DestinEStreamer
Introduction
DestinEStreamer provides state-of-the-art compression and streaming technologies designed specifically for climate and Earth Observation data. It achieves exceptionally high compression rates without compromising quality, giving you seamless access to hundreds of terabytes of datasets, directly in your browser, on both desktop and mobile.
With StatOnEdge, an integrated tool, you can explore and analyse EO and climate data streams directly in your browser. All statistical calculations and visualisations are performed securely and locally through edge processing.
Optimized for the DestinE Digital Twins, DestinEStreamer simplifies data access and processing, helping you work faster and more efficiently. Advanced users can take advantage of the Python Toolbox to connect to data streams and generate data cubes on-the-fly for deeper analysis.
Experience the fastest way to access Digital Twins with DestinEStreamer.
Documentation Overview
The documentation consists of two main parts: a responsive web application and an API.
DestinEStreamer Web Application
The DestinEStreamer web application offers an interactive interface for accessing and visualizing climate and earth observation data. Below is an overview of its key features:
Visual Streams
-
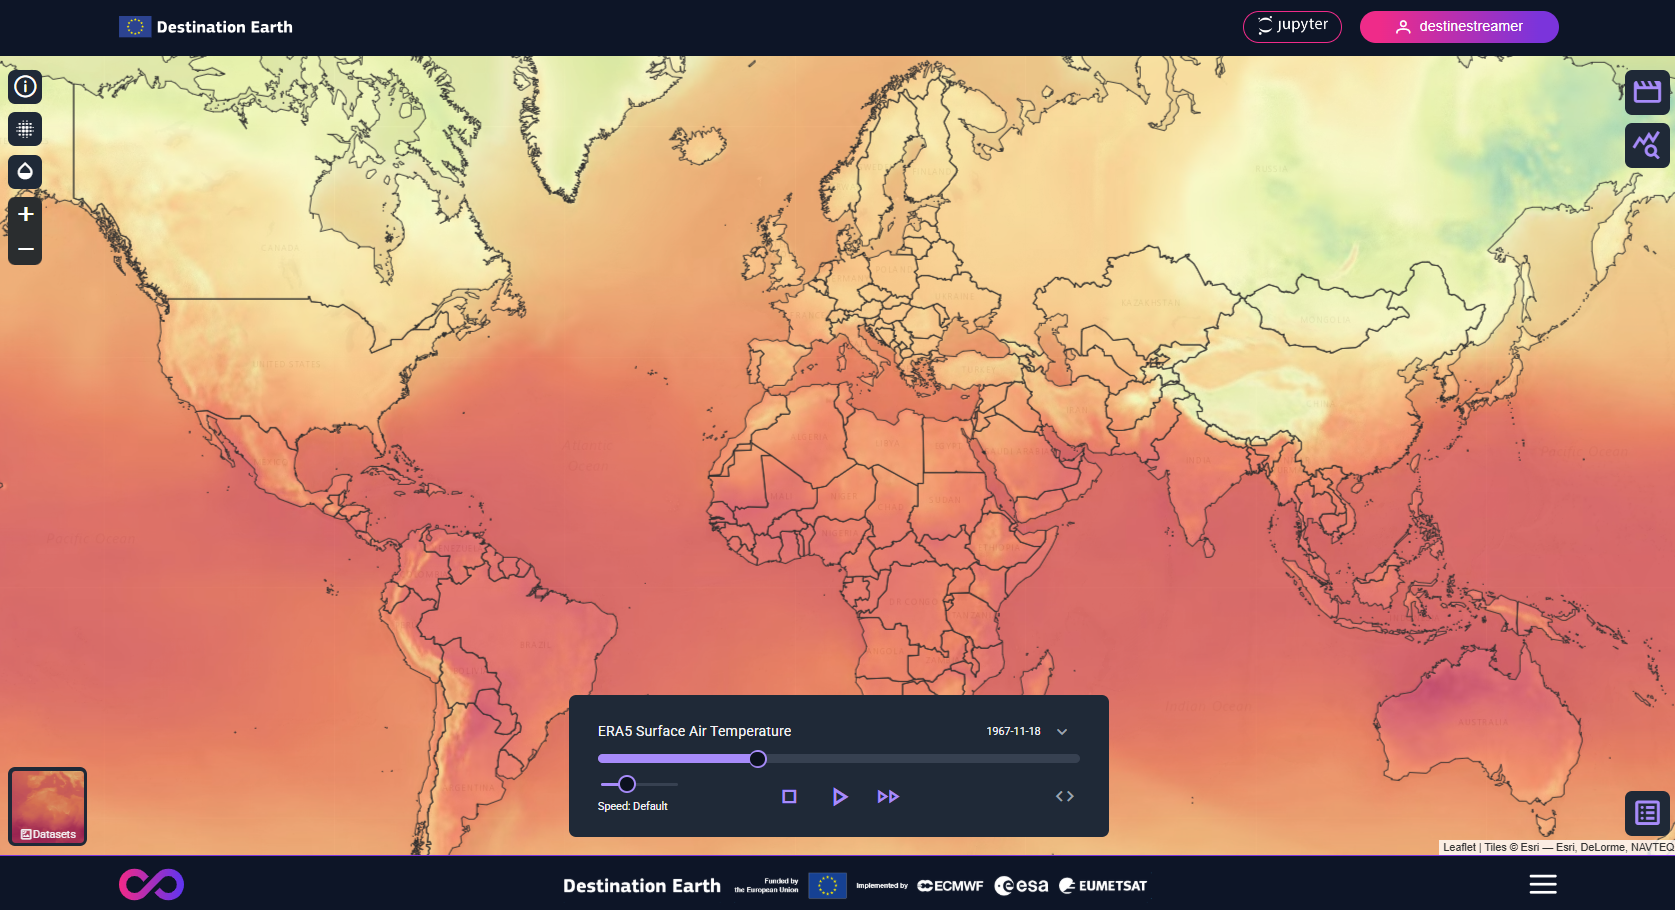
Temporal Resolution: In the web application overview, visual streams of climate data variables are displayed for daily intervals. Note that data streams, accessible via the API or Jupyter notebook, provide access to full temporal resolution.
-
Spatial Resolution: On mobile devices, visual streams are presented at a lower resolution to ensure optimal performance. Full resolution is accessible via the desktop browser.
Choosing a Dataset
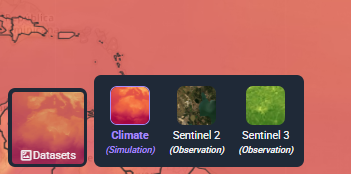
On the bottom left, different datasets can be selected and viewed. Currently, DestinEStreamer offers Climate, Sentinel 2 and Sentinel 3 NDVI datasets.
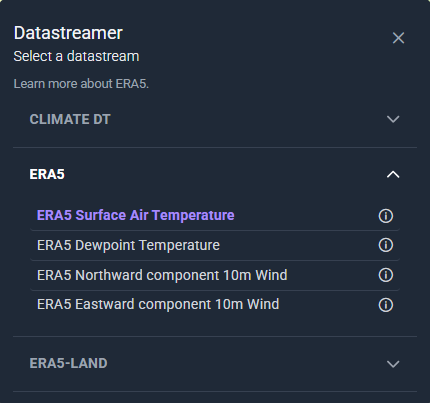
Available Climate data streams
The Climate data streams available on the platform are categorized into 3 main groups:
-
Climate DT
-
ERA5
-
ERA5-Land
Different Climate data streams can be selected using the Media button located on the top right side of the interface.

Available Sentinel 2 data streams
Sentinel-2 data is observational and provides high-resolution optical imagery. Some regions may appear partially obscured due to cloud cover, seasonal changes, or acquisition gaps between satellite passes. For more info click here.
DestineStreamer offers the following Sentinel 2 data streams:
- Europe
- Ukraine
Users can select to view Sentinel 2 data streams by selecting a tile on the map. S-2 data is organized by map tiles to optimize performance and loading speed.
Observation year selection
Users can choose an observation year by using the date pickers on the top right.

Basemap selection
Users can choose between two different base maps: EOX S2 Cloudless and Open Street Map according to preference.

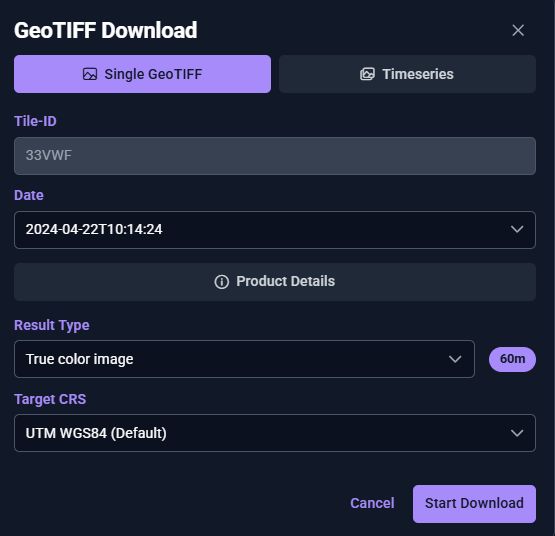
Download GeoTIFFs and timeseries
Users can download single GeoTIFF files or timeseries by selecting a date, result type and providing additional details such as the target CRS, spectral indices, or band selection.
The following result types are available:
- True color image
- Spectral indices: NDVI, NDWI, NDBI, MNDWI, NDMI
- Bands: 10m, 20m, 60m resolutions
Notes:
- Timeseries downloads are available only for true color images and bands.
- Downloads are restricted to Upgraded Access and Tenancy users.
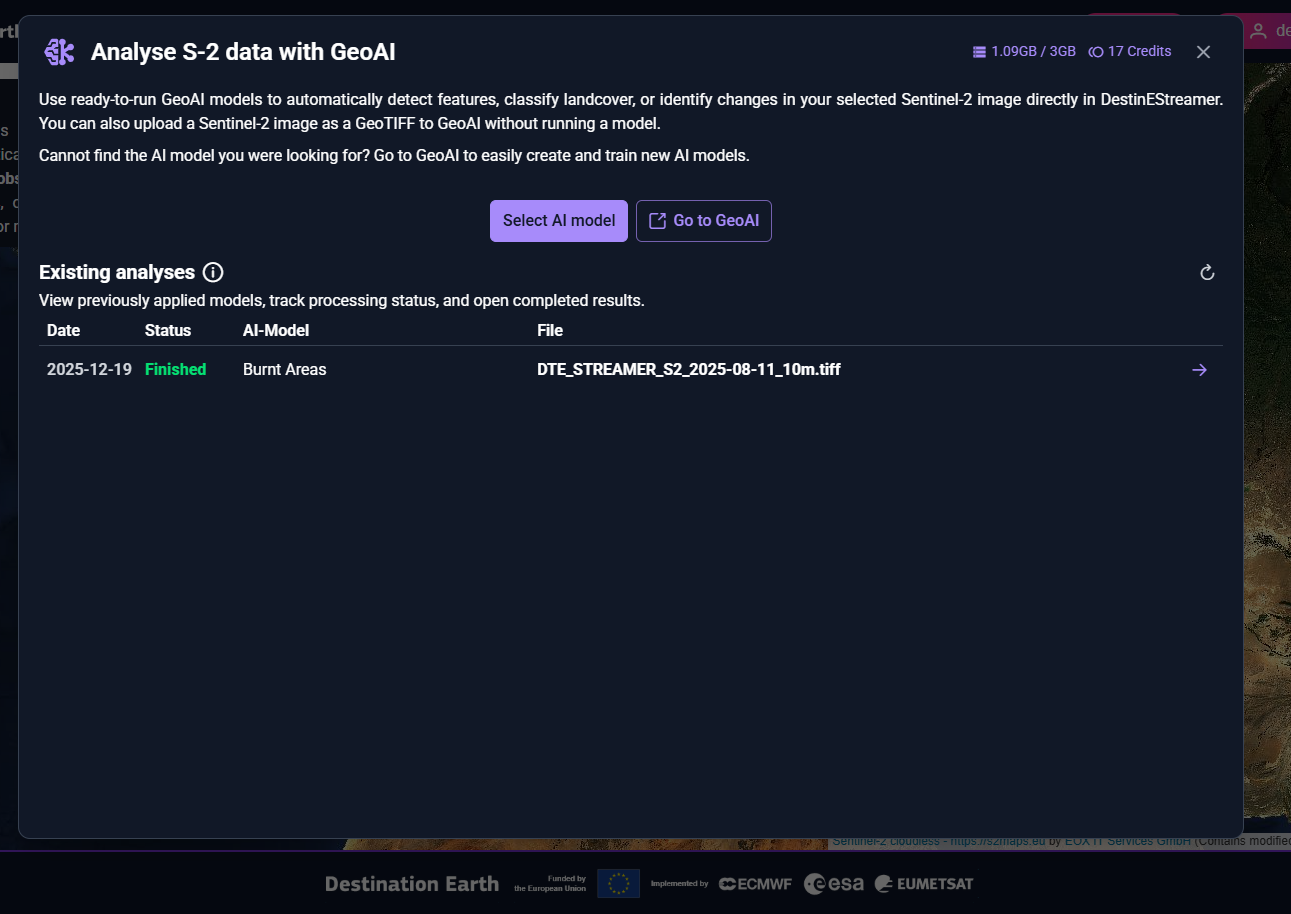
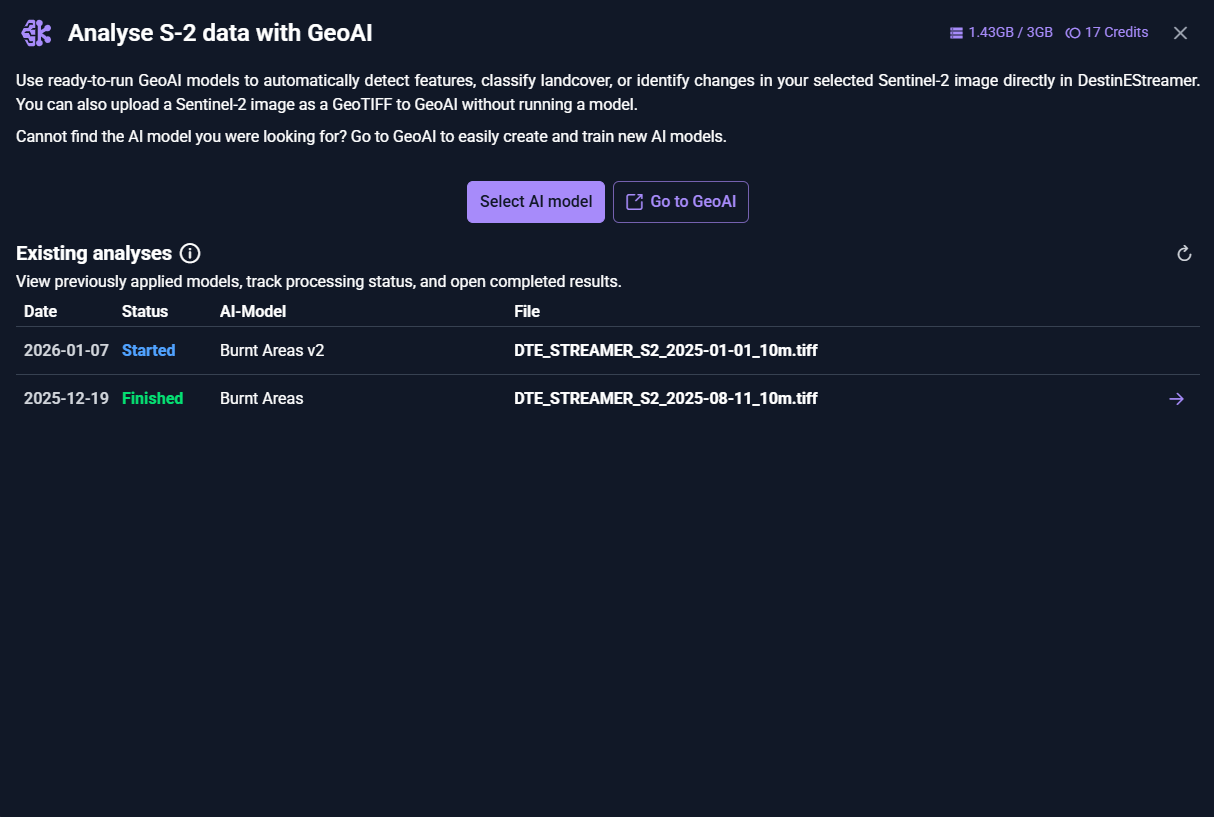
Analyse S-2 data with GeoAI
Users can apply ready-to-run AI models from GeoAI or self-created GeoAI models to a selected Sentinel-2 image directly within DestinEStreamer.

Overview
Users can view their current storage quota and available credits in the top-right corner of the interface. The status and results of running and completed analyses are displayed in the overview section below. To start a new analysis, click Select AI Model. To create or manage AI models, use Go to GeoAI to continue in the GeoAI application.
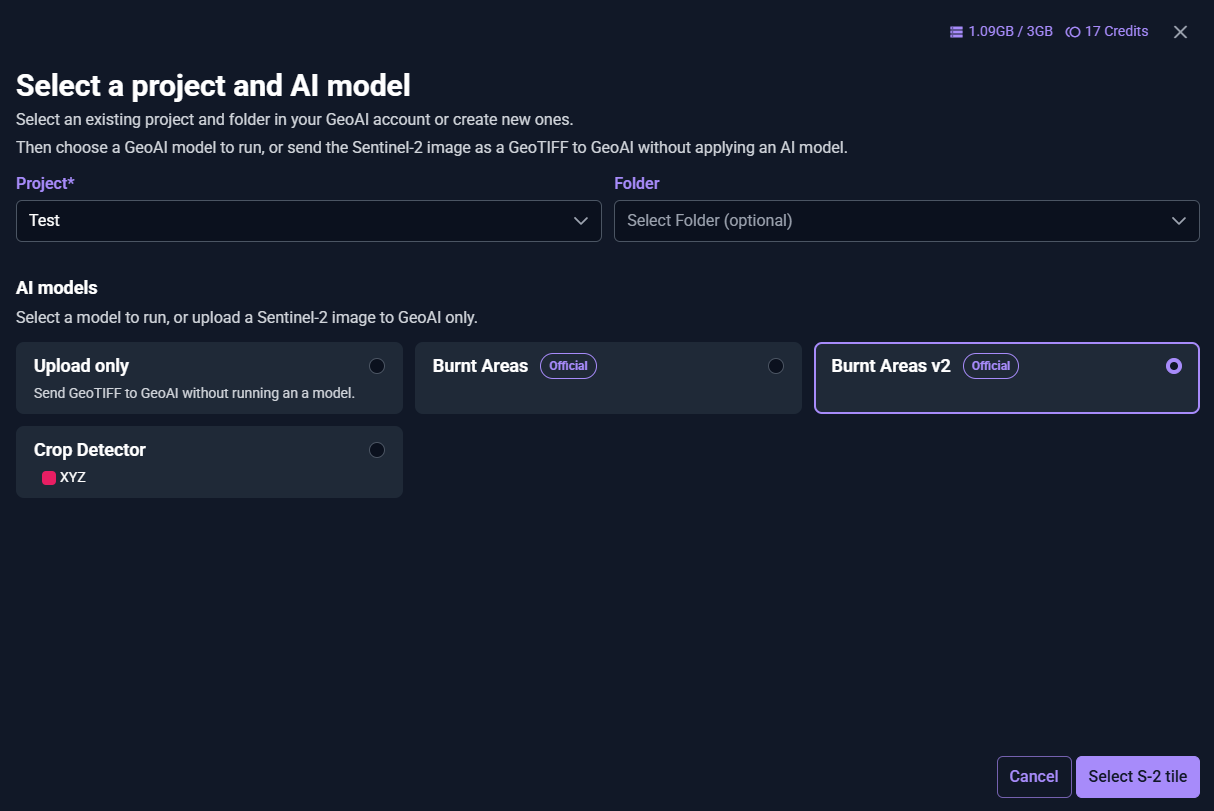
Select a project and AI model
Users select an existing project or create a new one to store the results of the AI analysis. Selecting a folder is optional. They can then choose an AI model to run or only upload a S-2 image to GeoAI without applying a model. GeoAI offers two ready-to-run models: Burned Areas Detection and Cloud Detection. While these models are continuously improved, results may contain inaccuracies. To proceed, click Select S-2 Tile to continue to the next step.
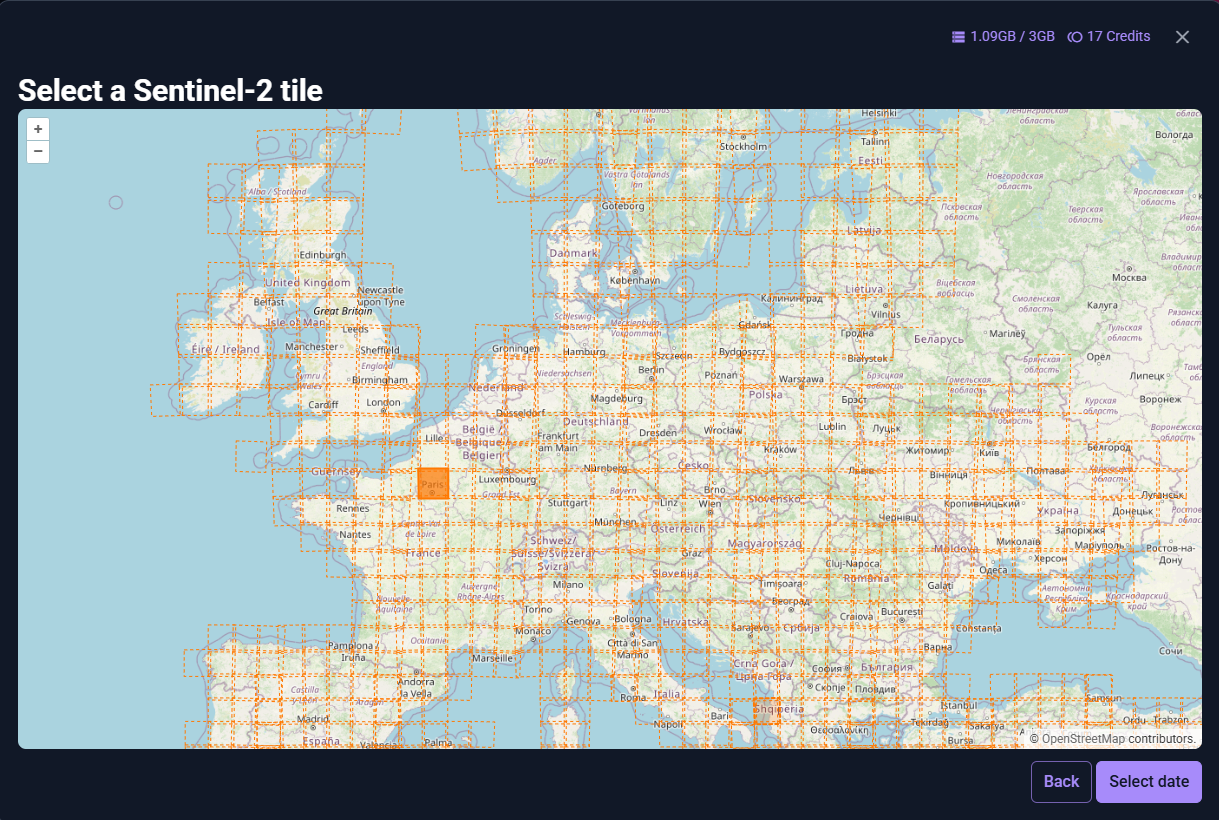
Select a Sentinel-2 tile
Users select a S-2 tile using the map interface. For optimal performance, only one tile can be selected per analysis. To proceed, click Select data to continue to the next step.
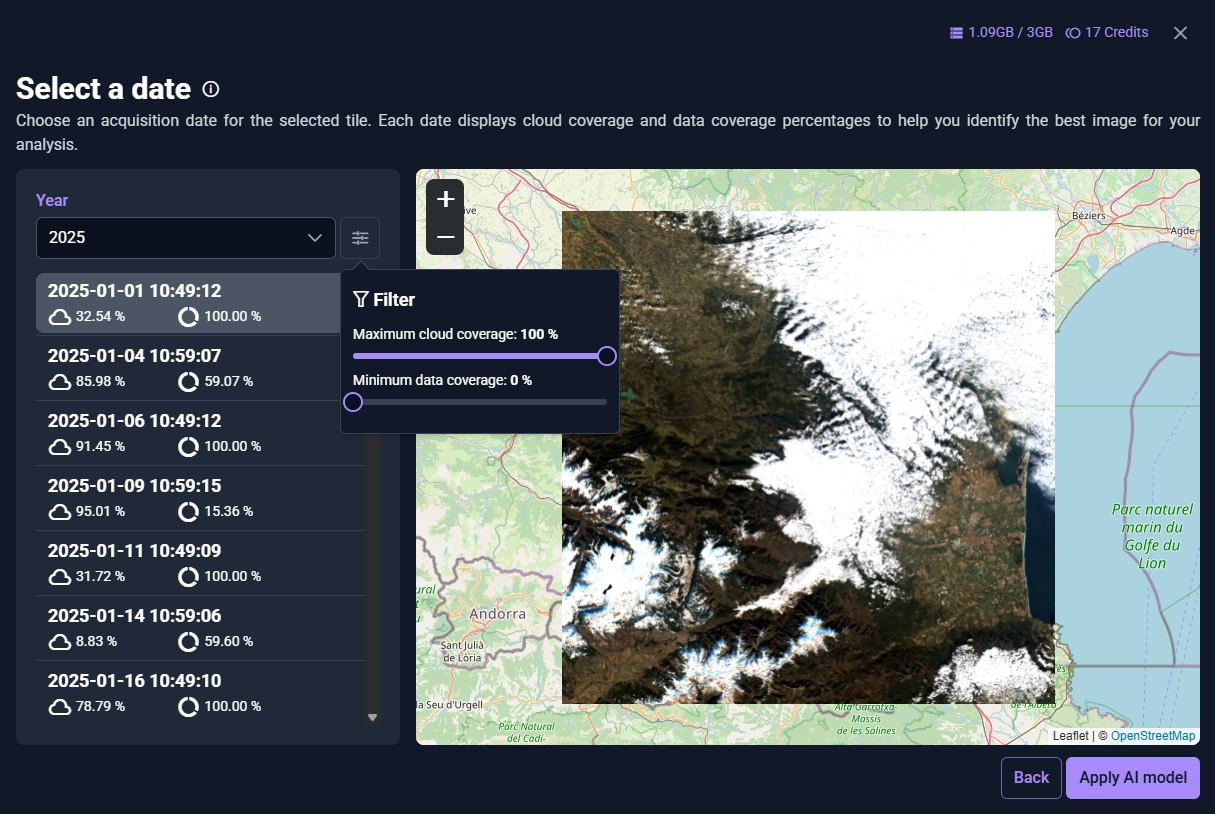
Select a date
Users choose a Sentinel-2 image acquisition date for the selected tile. For each date, cloud coverage and data coverage percentages are displayed to support the selection of the most suitable image for analysis. Filters for maximum cloud coverage and minimum data coverage can be used to further refine the selection. To proceed, click Apply AI Model to start the analysis.
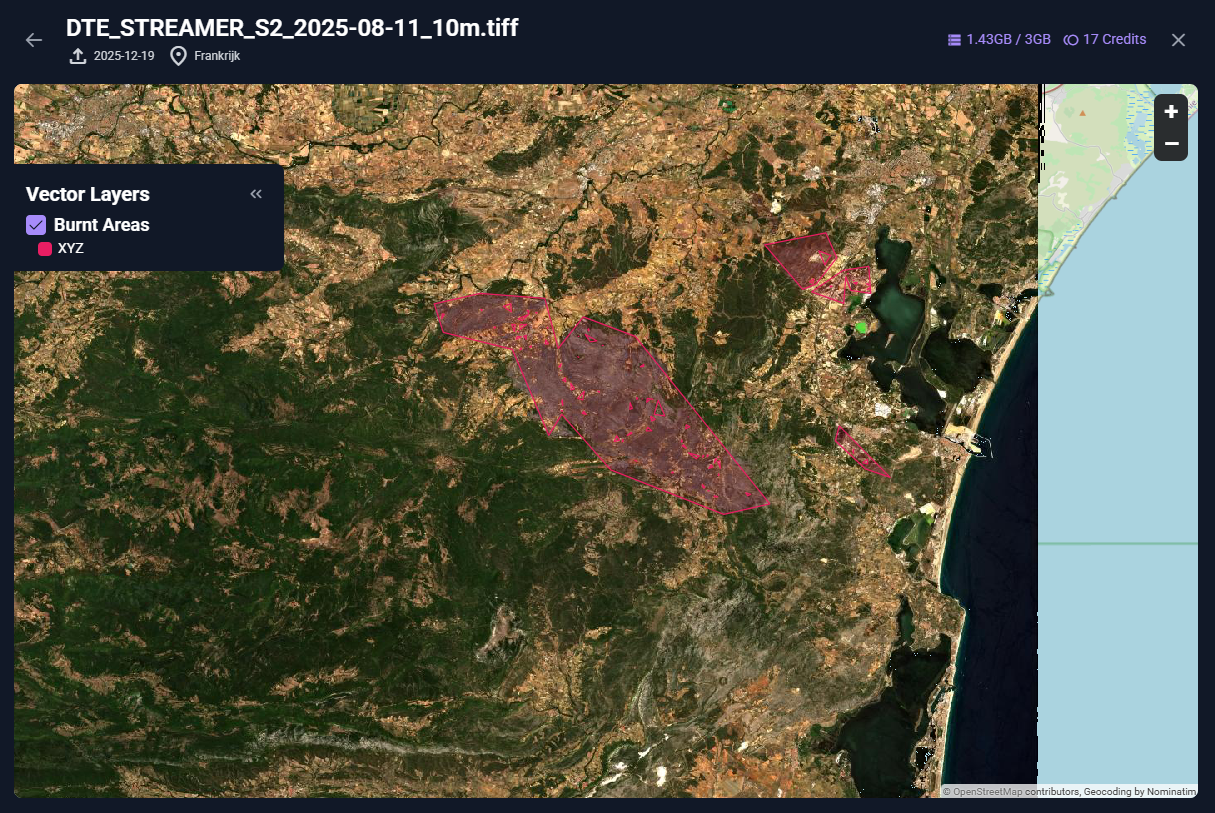
View analysis results
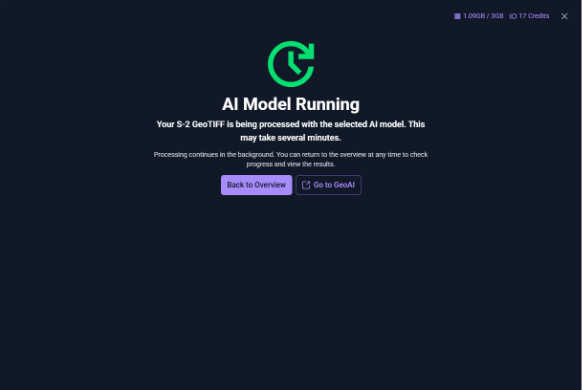
After the image is uploaded, the selected AI model is executed. Processing may take several minutes and continues in the background. Users can return to the Overview at any time to monitor progress and access results once the analysis status is marked as Finished.
Results are displayed as an interactive vector layer, which can be toggled on and off in the map. All results are stored and can be reopened for review at a later time.
Available Sentinel 3 NDVI data streams
Sentinel-3 NDVI data is observational and updated twice per month. Some areas may show gaps due to cloud cover or the way satellite swaths capture data. For more info click here.
DestineStreamer offers the following Sentinel 3 data streams:
-
Sentinel 3 Normalized Difference Vegetation Index (NDVI)
- Europe
- Africa
- North America
- Greenland / Iceland
- Central America
- South America
- North Asia
- South East Asia
- West Asia
- Asian Islands
- Australasia
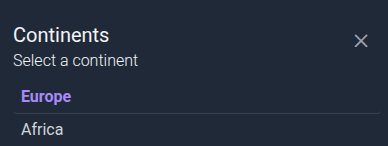
Continent selection
Users can select to view the data stream of a different continent via the Earth button on the top right of the interface.

Basemap selection
Users can choose between two different base maps: EOX S2 Cloudless and Open Street Map according to preference.
Download GeoTIFFs and timeseries
In the Stream Controller, users can click on the download icon to start downloading Sentinel-3 GeoTIFFs.
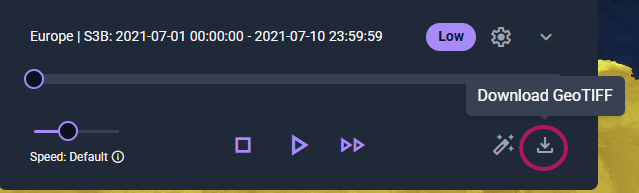
Users can download single GeoTIFF files by selecting an Area of Interest by drawing on the map and a desired time range. Users receive one GeoTIFF for each acquisition date within the selected time range and for each satellite capturing data (Sentinel-3A and 3B).
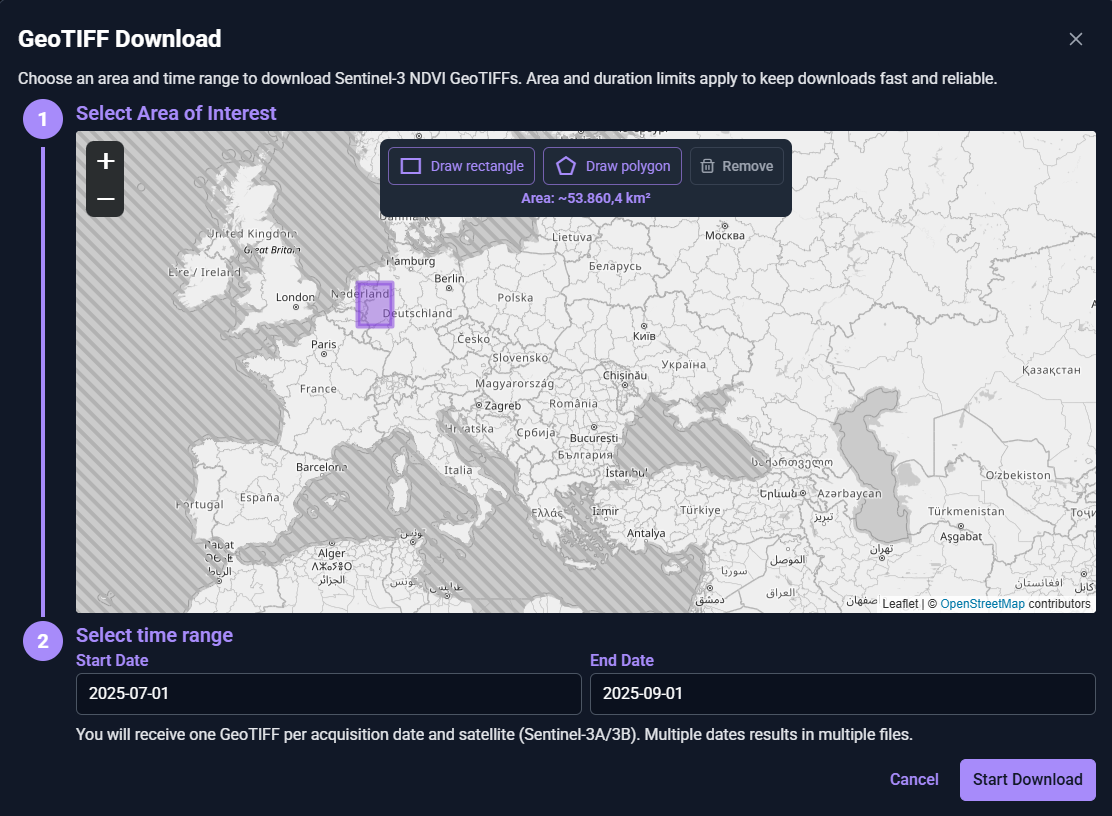
Note: The area and duration limits are restricted to keep downloads fast. The bigger the area selected, the shorter the time range can be for the download. Downloads are restricted to Upgraded Access and Tenancy users.
General Controls
The user can find general viewing controls on the top left of the interface.
Info button
An Info button is available on the top left side of the interface. This button provides an overview of the DestinEStreamer, explaining the purpose it offers to users.

Opacity Control
The Opacity Control button allows users to adjust the opacity of the displayed data streams, providing more control over the visualization experience.

Zoom Controls
The Zoom controls let users adjust the map view by zooming in for a closer look at specific areas or zooming out to see a broader overview.

Spatial Interpolation Control
The Spatial Interpolation control allows the user to look at the data stream visualisation as a continuous (interpolation enabled) or pixelated (interpolation disabled) surface on the map. Geostatistical methods are used to fill the gaps between known values from sampled locations.
Note:
- Interpolation is not supported in Safari browsers.
- Spatial interpolation is unavailable for Sentinel-2 streams.

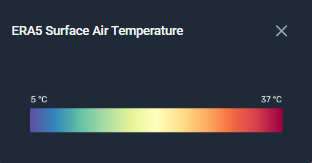
Legend
In the bottom right corner of the interface, users will find the Legend of the selected stream. The Legend provides contextual information about the currently selected data stream.
Stream Controls
Located at the bottom centre of the Map View, the stream controls allow users to interact with the data stream similarly to a video player. You can play, pause, and scrub through the timeline to explore different points in the data.
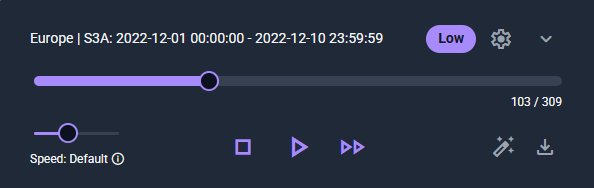
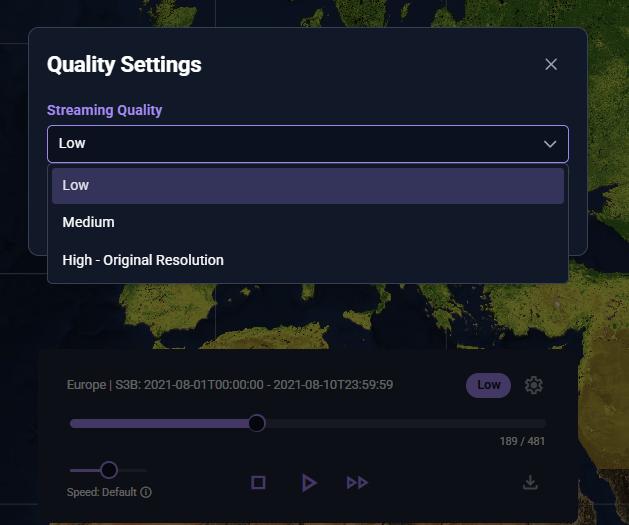
Change resolution
In the Stream Controller, users can click the settings icon to adjust the stream resolution. This feature is available for Sentinel-2 and Sentinel-3 streams.
Please note that selecting a higher resolution may affect performance depending on your bandwidth, connection quality, and device capabilities.
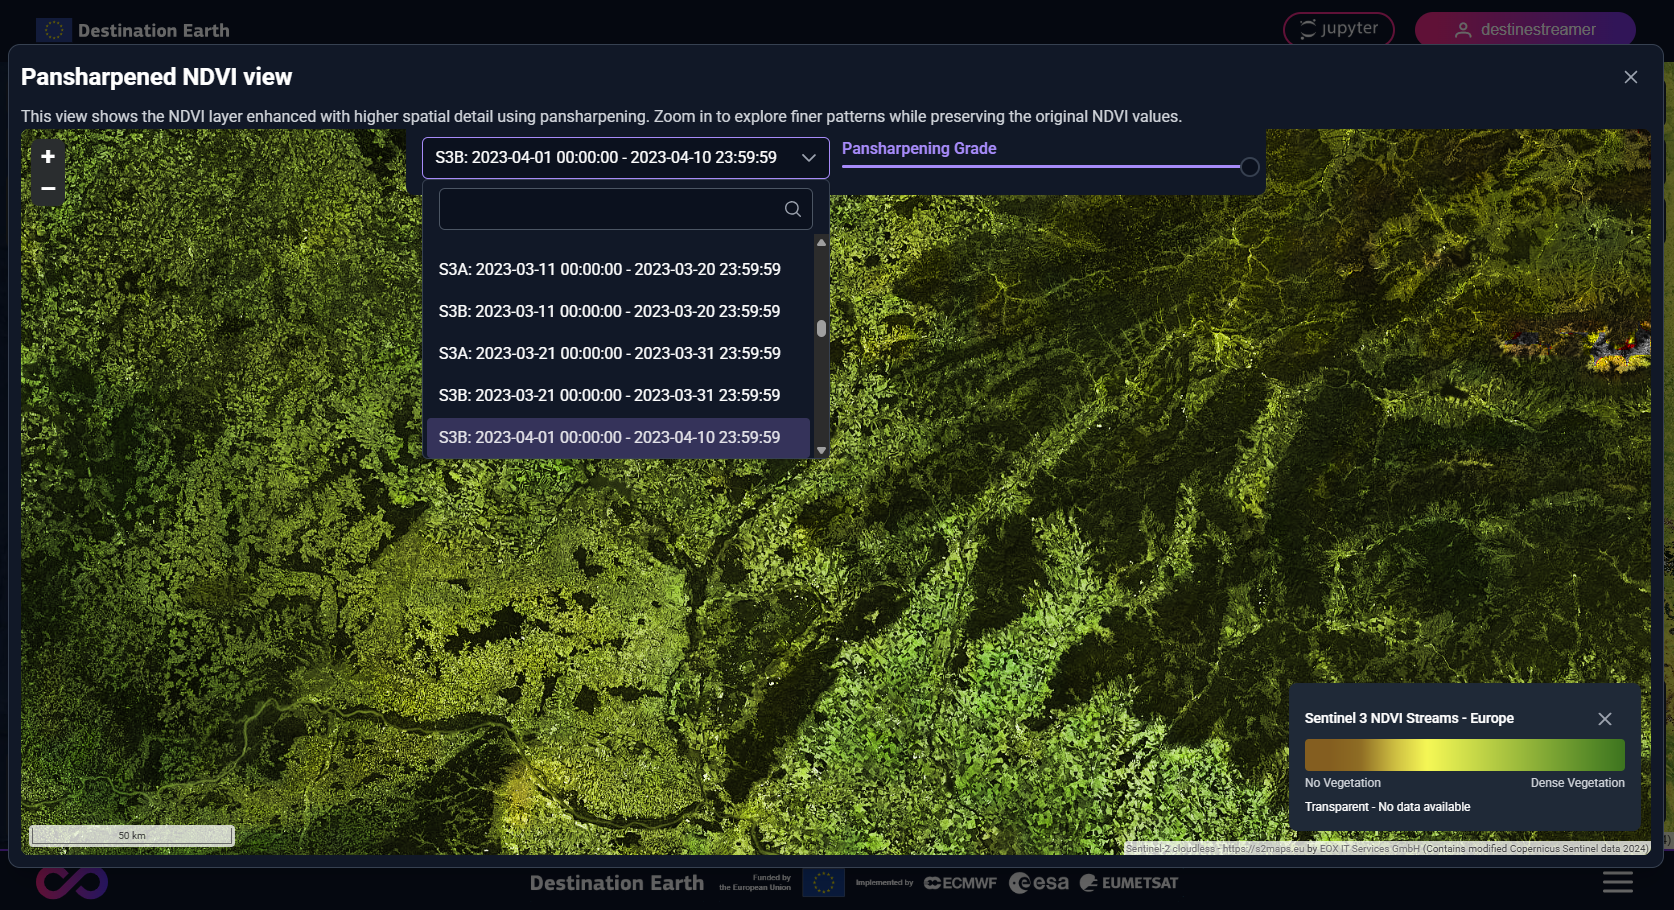
Pansharpening
In the Stream Controller, users can click on the magic wand icon to activate the pansharpening feature. In a new window, users can see the Sentinel-3 NDVI layer with higher spatial detail. Zoom in to explore finer patterns while the original NDVI values are preserved.
Note: This feature is only available for Sentinel-3 streams.
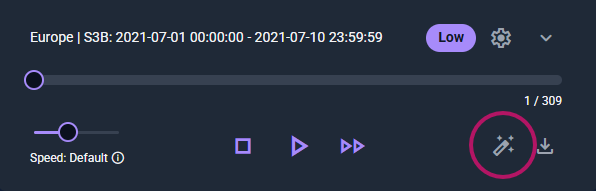
The pansharpened view allows users to zoom in and out, adjust the pansharpening grade and select other dates/years.
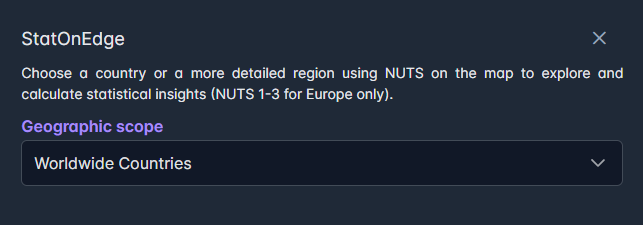
StatOnEdge
DestinEStreamer provides a built-in tool called StatOnEdge, which allows users to explore and analyse EO and climate data streams directly in the browser. Statistical calculations and visualisations are performed securely and locally with edge processing.
Note: StatOnEdge currently supports all Climate data streams and Sentinel-3 NDVI streams.
Accessing the tool
Users can open StatOnEdge by clicking the Graph button located at the top right corner of the interface in the Climate and Sentinel-3 datasets.

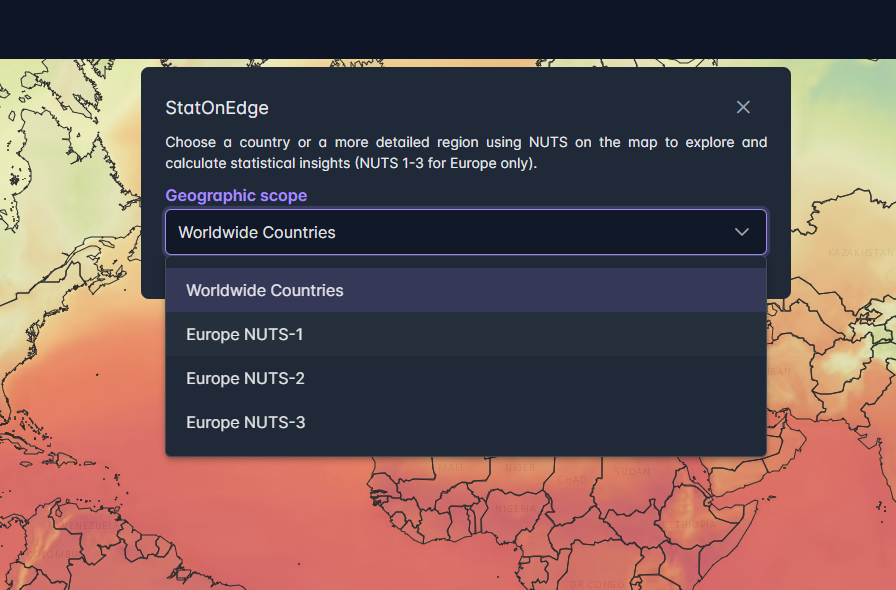
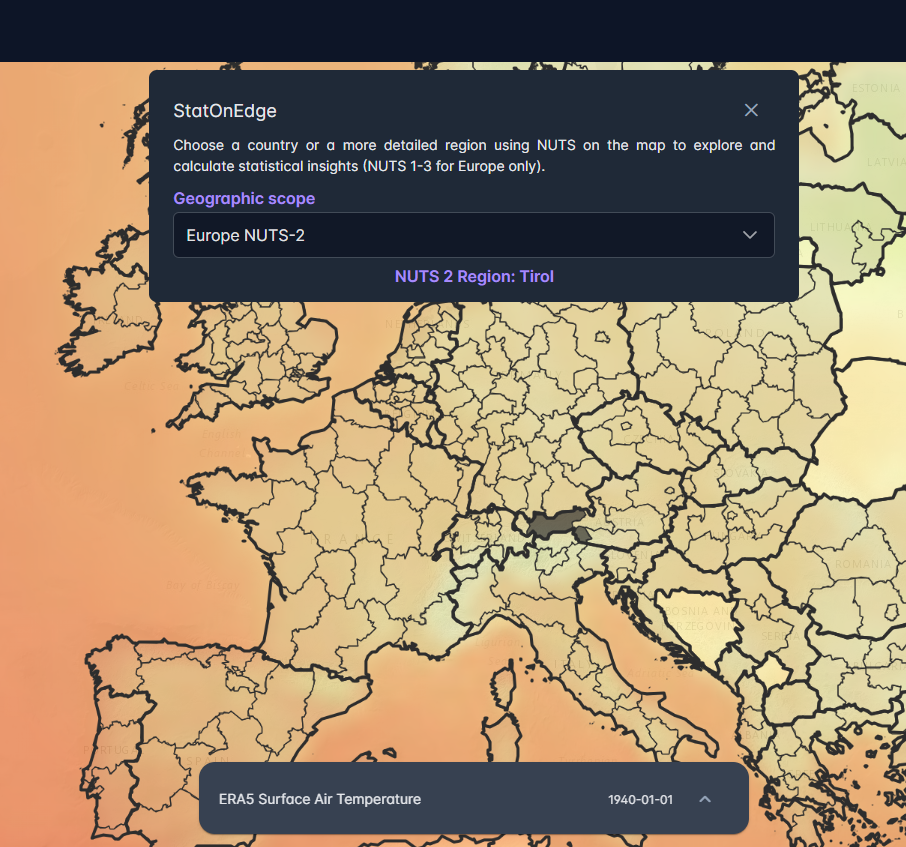
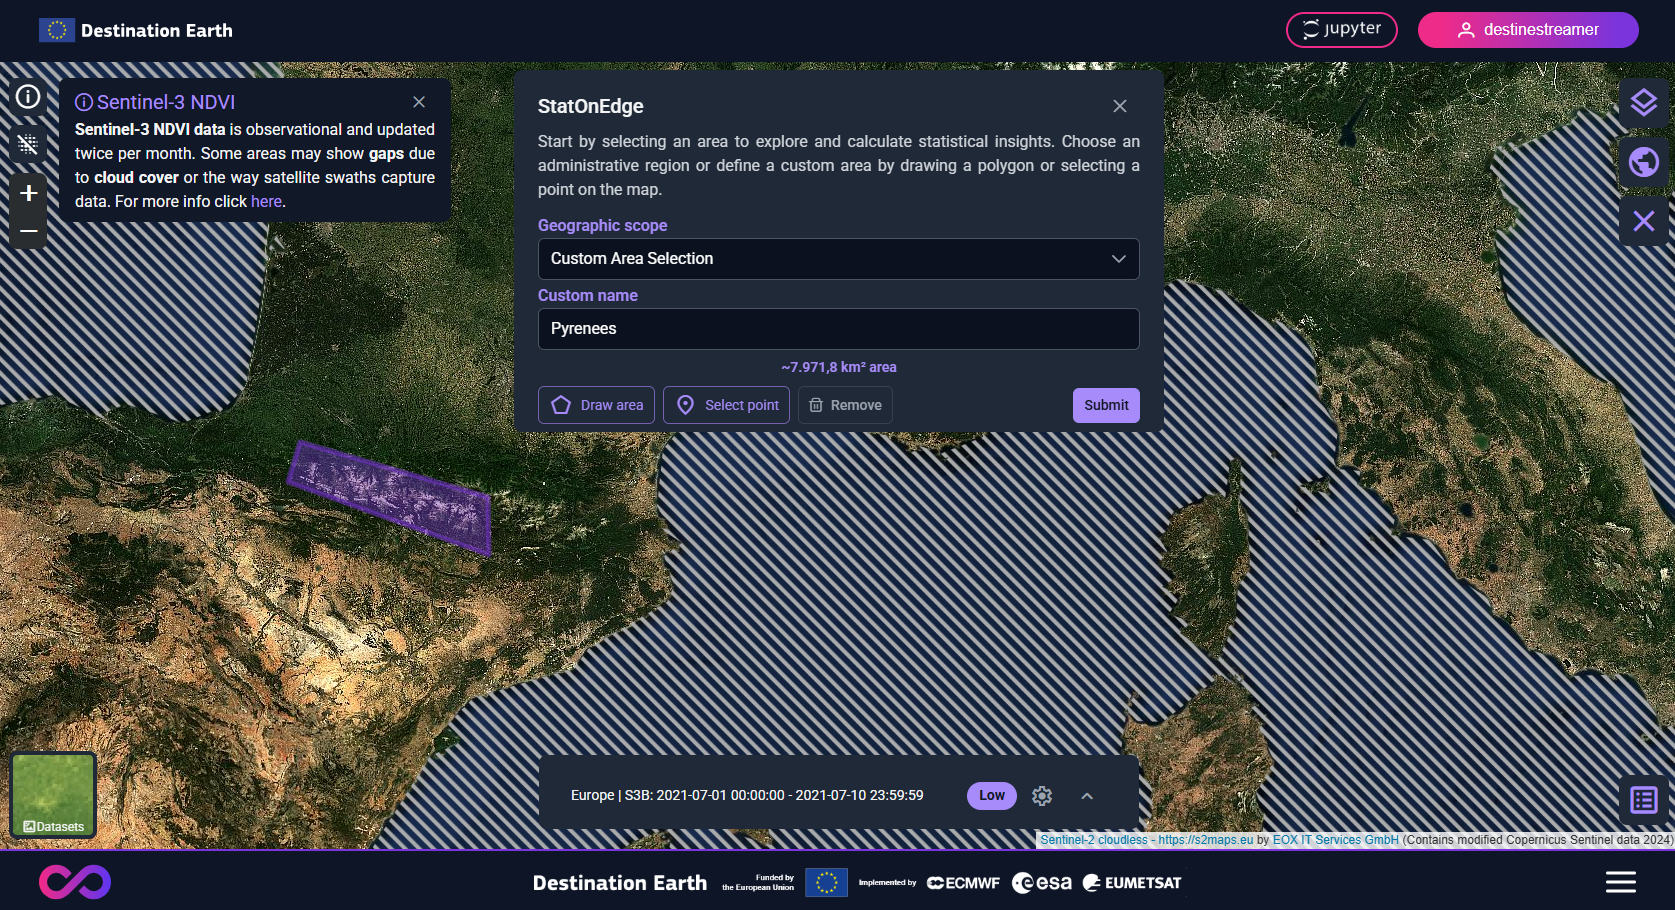
Selecting a region
Begin by selecting a country or region on the map. For Europe, you can choose from NUTS levels 1 to 3. Users can alternatively select a custom area by either drawing an area or selecting a point on the map. Once a region or an Area of Interest is selected, the StatOnEdge parameter selection screen will appear.
Defining input parameters
Next, configure the input parameters needed to calculate the statistics. You can specify multiple parameters based on your requirements. For quick exploration, pre-defined presets are provided in a dropdown menu.
Tip: If the start and end year are the same, you can select multiple months. Otherwise, only one month is allowed. Selecting a day is optional. If no day is chosen, the system will calculate the average value over the selected month(s).
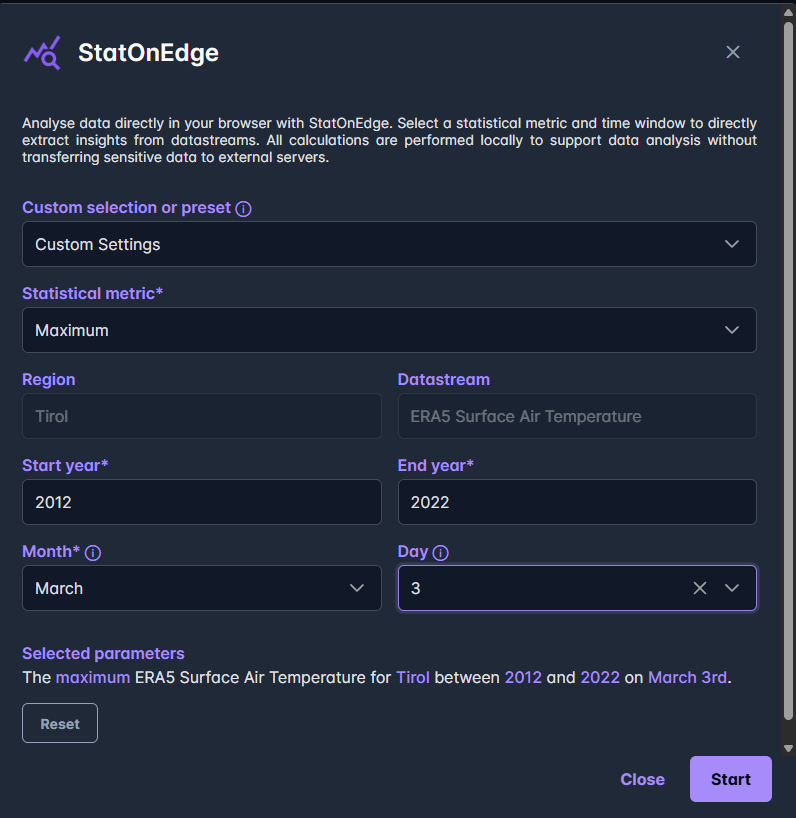
Review and start analysis
A summary of the selected parameters is displayed at the bottom of the parameter selection screen. When you are ready, click Start to begin the calculation.
View and Export results
The results will be shown in a new window as a line graph. To download and save your results, click the Download CSV button.
Advanced Features
We offer additional tooling and features for users with Upgraded Access privileges on the DestinE platform:
-
The option to download single or timeseries GeoTIFFs for Sentinel 2 and Sentinel 3 NDVI data streams
-
The option to display a code snippet to configure the JupyterLab Notebook to access the exact data selected and shown in the web application.
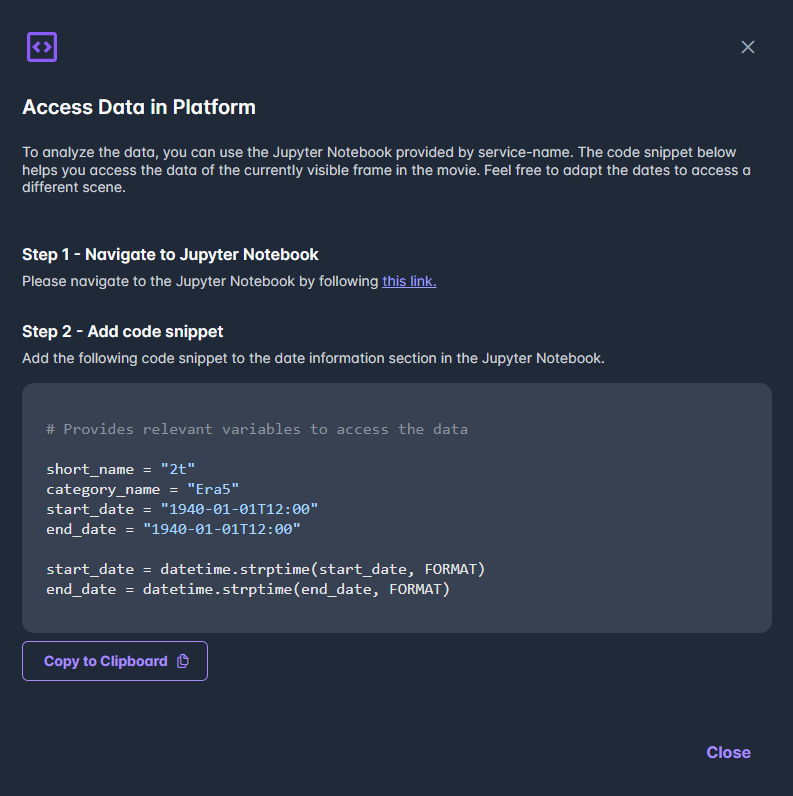
Tip: JupyterLab Notebooks can also be accessed via the Jupyter button on the top right of the home screen

API Endpoints
For detailed API documentation, please refer to the Swagger interface available here.